2 Bitcoin graphs you need to know today (and what they mean) 📈; Crypto Super Bowl Ads failed? 😕; Digitizing school pay in Africa 💸
Good Morning FinTech, 26 April
Good morning Everyone,
And happy Tuesday! While yesterday was dominated by the legendary Elon Musk finally acquiring Twitter, some really interesting stuff was cooking in the FinTech space too. Check out 3 hot stories I’ve prepared for you today:
2 Bitcoin graphs you need to know today (and what they mean) 📈
The markets 📊 Unsurprisingly, crypto markets have been pretty volatile as of late, and so was Bitcoin, the biggest and most popular cryptocurrency out there. While BTC is currently trading at around $40,000, this is still -41.2% from its all-time high in November last year.
Thinking about what might come next, there are two graphs that are definitely worth your attention.
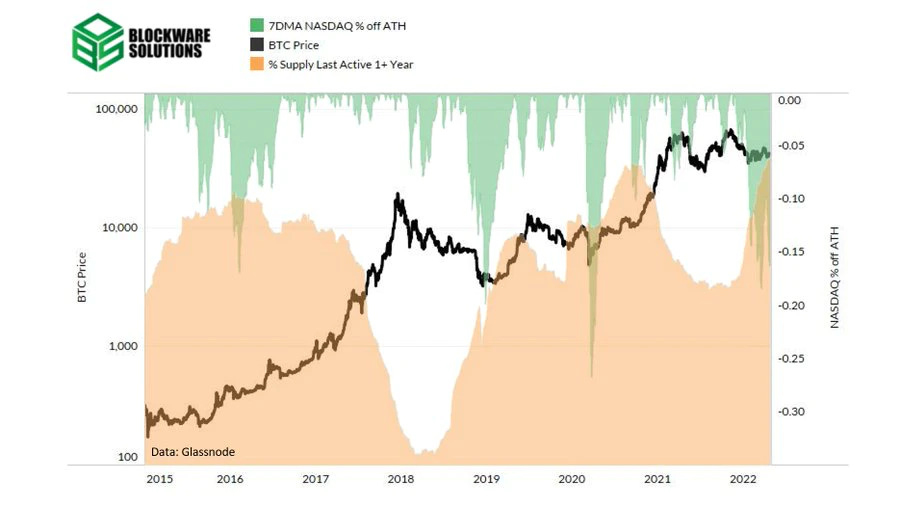
More data 👉 The first one shows the amount of supply that hasn’t moved in at least a year and it’s being compared to the 7DMA (7-day moving average) of how far the Nasdaq is off its highs.
As we can see above, despite the Nasdaq being down about 20%, an all-time high ~64% of Bitcoin’s circulating supply has not moved.
The second chart shows the long-term Bitcoin holders’ net unrealized profit/loss (NUPL).
As we can see from the data above, the was an excessive optimism among long-term holders that occurred when Bitcoin was trading at circa $64,000 (in March 2021). Since then, some profit-taking has happened among traders, perhaps in anticipation of long-term losses, similar to 2015 and 2019.
So what does this tell us about the future of Bitcoin? A few things. Here’s the takeaway:


