
Turn Claude Sonnet 4.6 Into Financial Analyst That Never Sleeps 📊
Most analysts are leaving 90% of Claude on the table. Here's the framework that turns the world's best-value AI into a senior financial analyst 📈

👋 Hey, Linas here! Welcome to another special issue of my daily newsletter. Each day, I focus on 3 stories that are making a difference in the financial technology space. Coupled with things worth watching & the most important money movements, it’s the only newsletter you need for all things when Finance meets Tech. If you’re reading this for the first time, it’s a brilliant opportunity to join a community of 370k+ FinTech leaders:
A first-year investment banking analyst costs north of $200,000 fully loaded. Claude Sonnet 4.6 - released 3 days ago - runs a complete DCF valuation for under $1 😳
On Finance Agent v1.1, Anthropic’s benchmark for agentic financial analysis, Sonnet 4.6 scores 63.3% - first place, ahead of GPT-5.2 at 59% and, more telling, ahead of Claude Opus 4.6 at 60.1%.
The model that beats every alternative on finance-specific tasks is not the expensive flagship. It’s the $3-per-million-token one, at 1/5 the Opus price. You now have access to the best AI for financial analysis at a cost that rounds to 0.
And the reason most people aren’t getting this yet is that raw capability is only half the equation. Prompting Claude like a search engine gets you analyst-intern output.
Prompting it with the right structure gets you investment-committee-ready analysis: phased methodology, visible assumptions, internal consistency checks, calibrated uncertainty. That gap is thus almost entirely about how you write the prompt.
Below, we break down what changed in Claude Sonnet 4.6, the proven framework, and the 12 fully engineered finance prompts that put it into practice.
What Actually Changed in Sonnet 4.6
Before the framework, let’s be precise about which capabilities matter for financial work, focusing on the specifics that change actual workflows.
It matches Opus on enterprise document comprehension. Sonnet 4.6 achieves parity with Opus 4.6 on OfficeQA, which measures a model’s ability to read enterprise documents - charts, PDFs, tables - extract the right facts, and reason from them. For finance, this means ingesting earnings transcripts, 10-Ks, CIM documents, and data tables and getting analysis that’s accurate, not just plausible-sounding.
Hebbia, an AI research platform focused on financial services, reported a jump in answer match rate on their internal Financial Services Benchmark - “better recall on the specific workflows our customers depend on.” Box evaluated Sonnet 4.6 on deep reasoning across real enterprise documents and found that it outperformed Sonnet 4.5 by 15 percentage points in heavy reasoning Q&A.
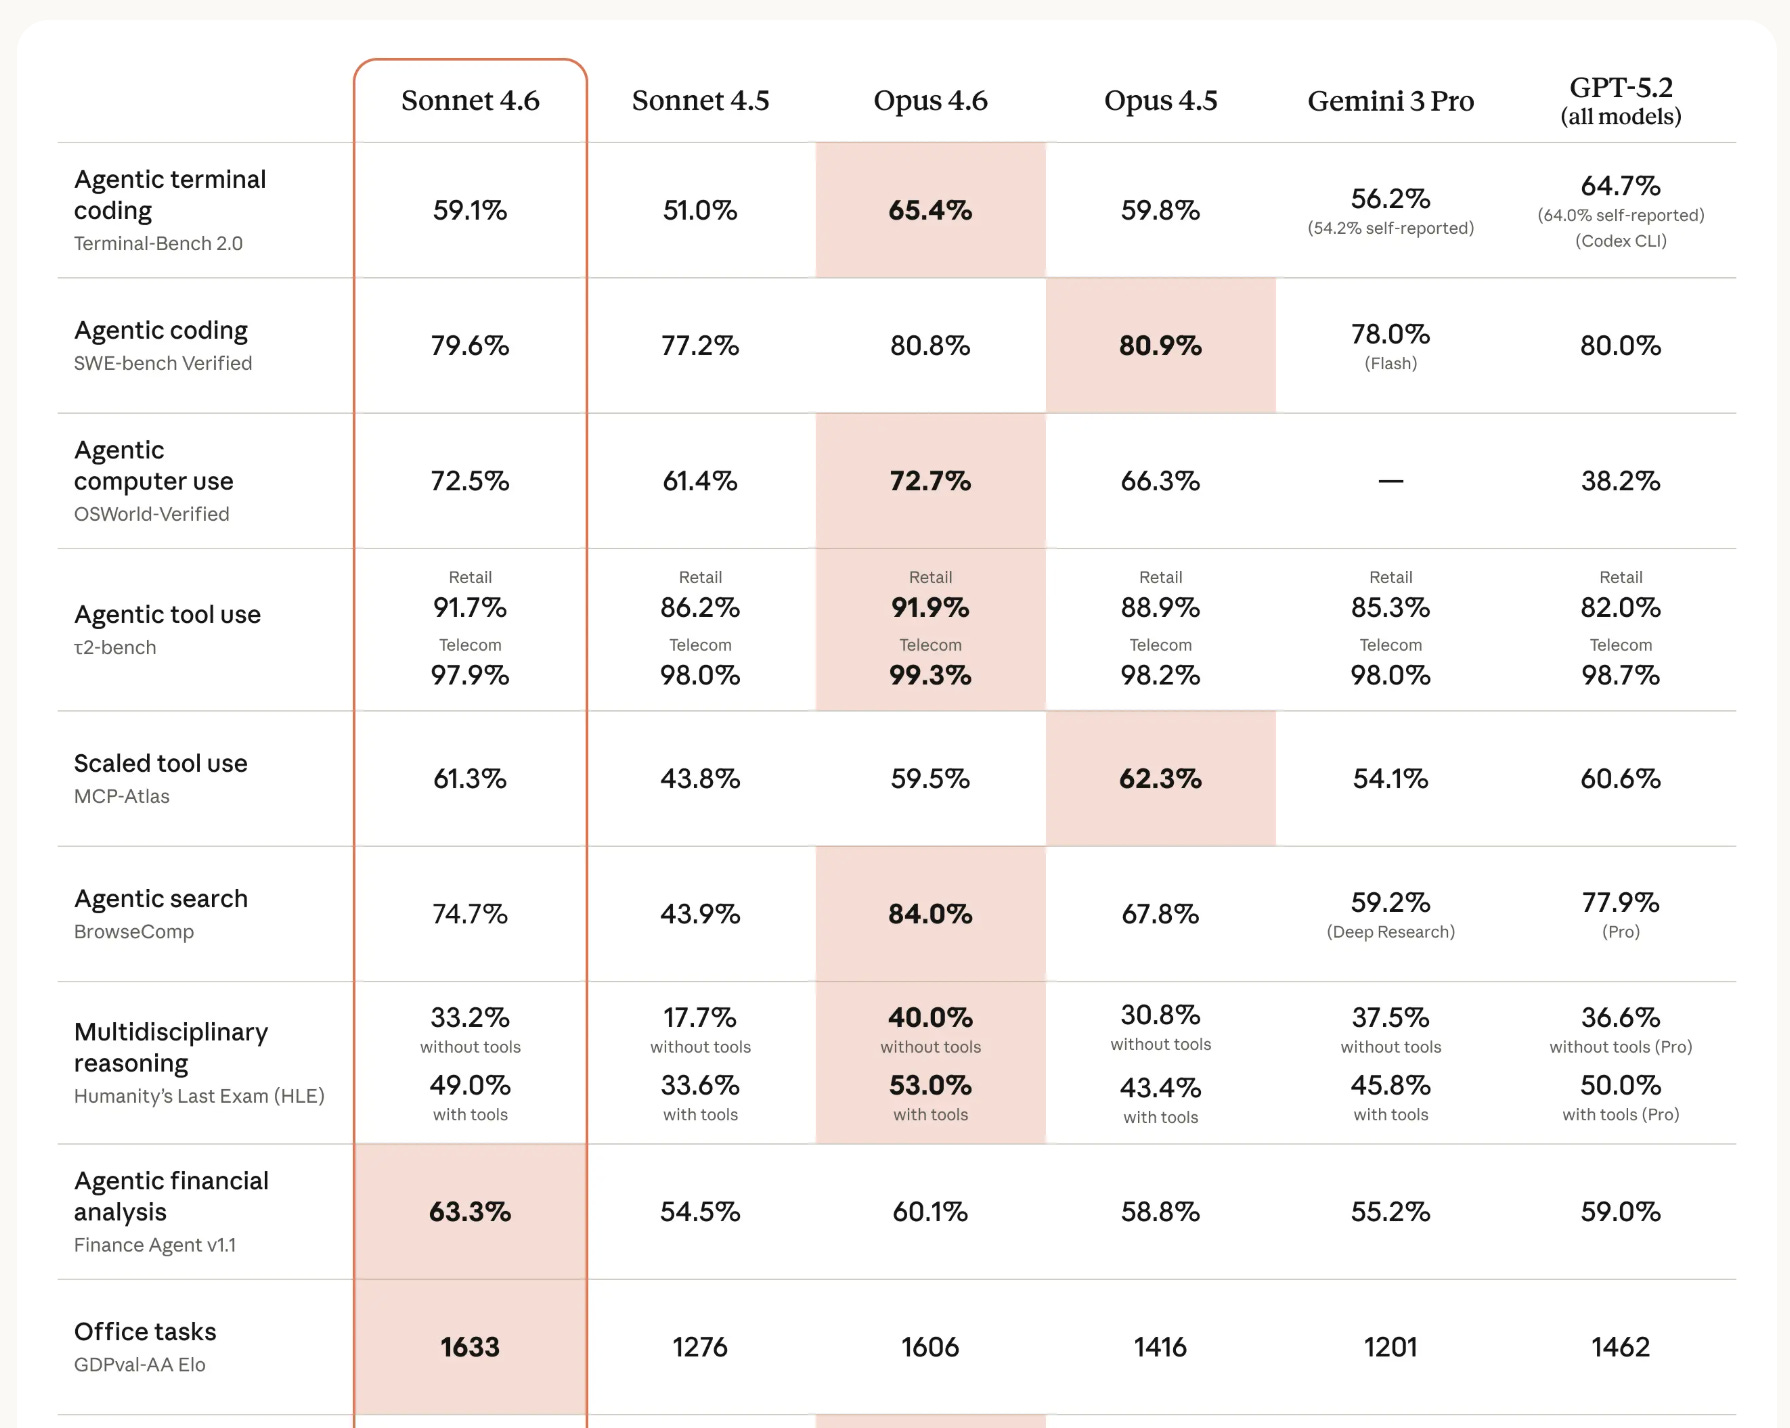
It leads every model on the Finance Agent benchmark. Finance Agent v1.1 measures agentic financial analysis - multi-step, tool-using work that approximates a real analyst workflow. Sonnet 4.6 scores 63.3%, ahead of Opus 4.6 (60.1%) and GPT-5.2 (59%). The model built for this use case is not the expensive one.
It has a 1 million token context window (beta). That’s enough to hold an entire company’s financial history, a full deal document set, or dozens of research reports in a single request. Sonnet 4.6 doesn’t just retrieve across that context - it synthesizes. The Sonnet 4.5 context window was 200K tokens. That’s a 5X expansion.
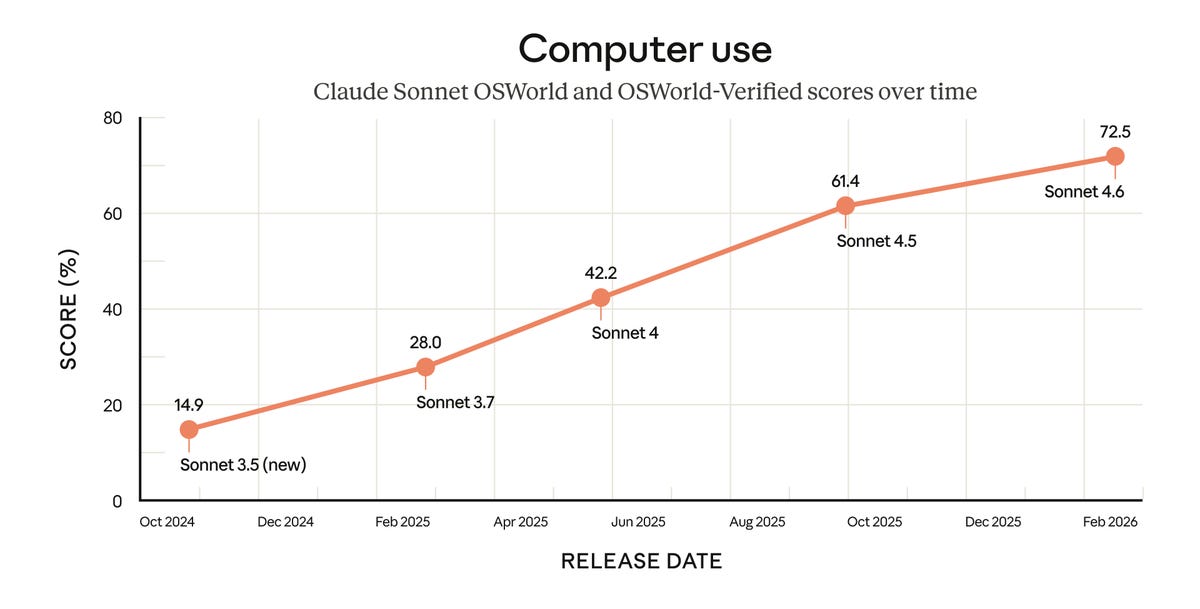
It can use your computer. Sonnet 4.6 scores 72.5% on OSWorld-Verified - the standard benchmark for AI performing real computer tasks - versus Opus 4.6’s 72.7%. The gap is 0.2 percentage points. In practice: Claude logs into software, navigates interfaces, clicks through workflows, and completes multi-step tasks in tools with no API, including legacy financial systems. Early users report it navigating complex spreadsheets, filling out multi-step web forms, and operating across multiple browser tabs without manual handholding.
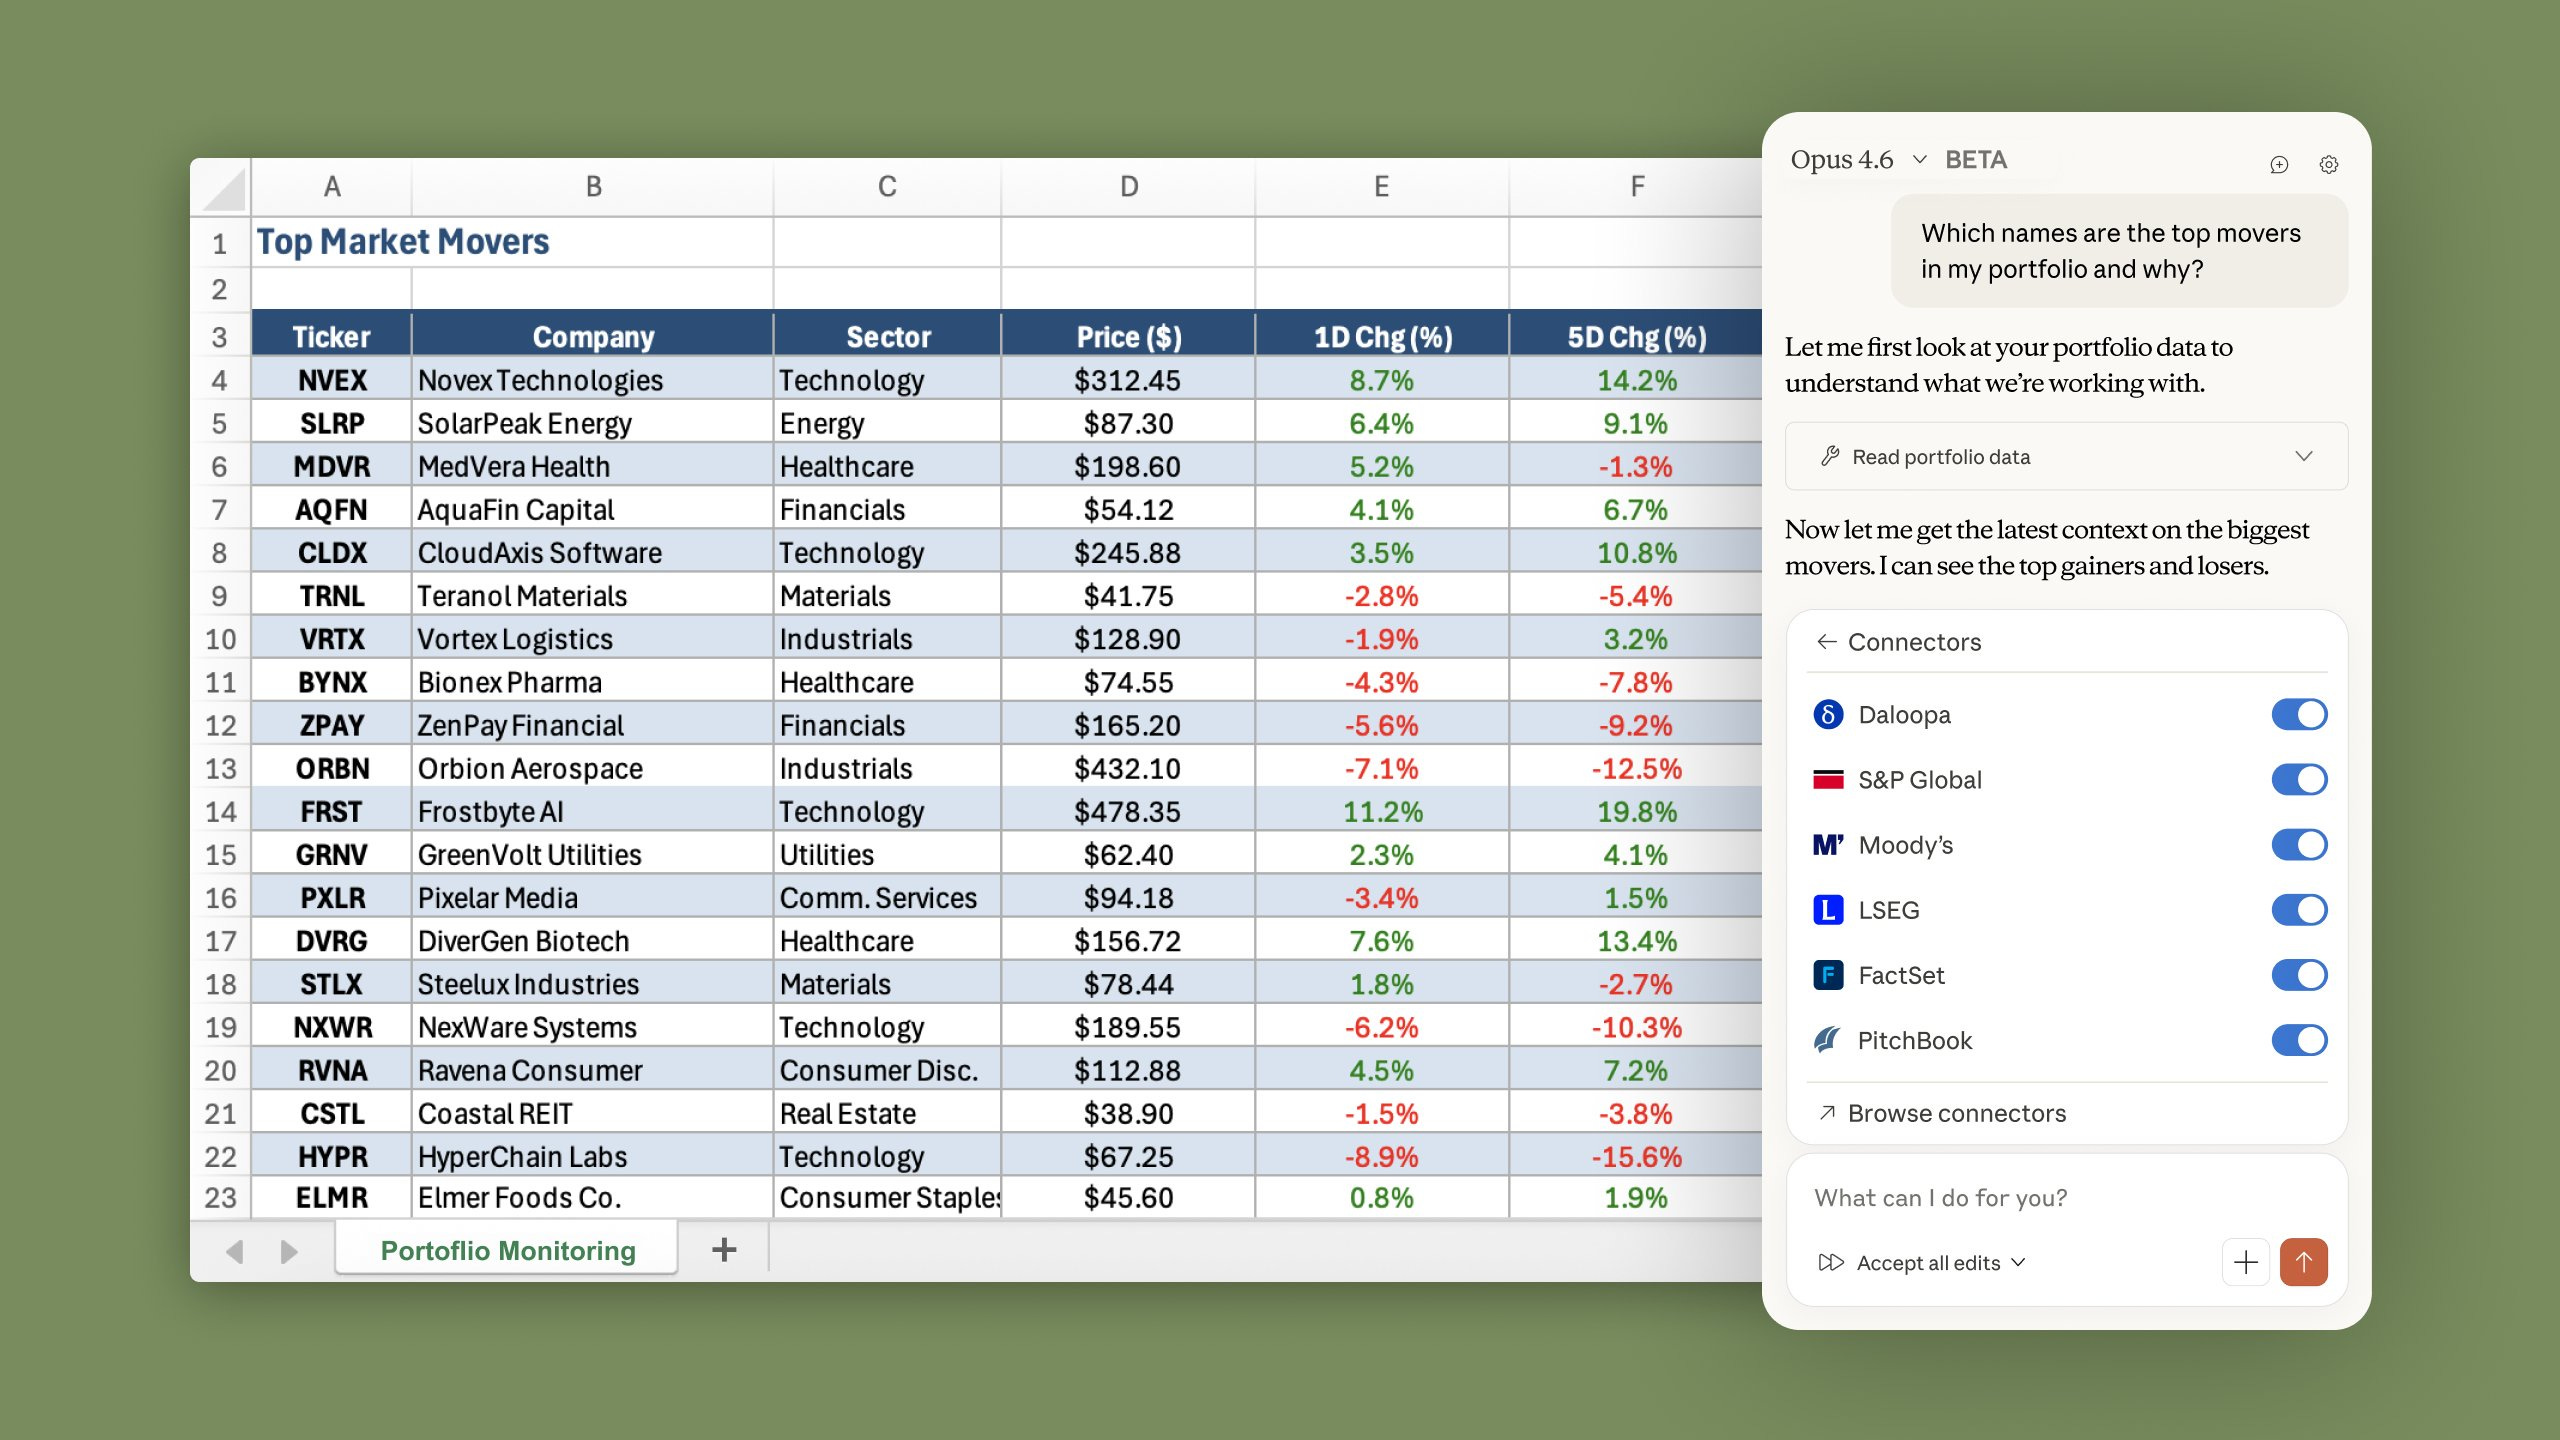
It connects to your financial data sources natively. Claude in Excel now supports MCP connectors, meaning Claude can pull live data from S&P Global, LSEG, Daloopa, PitchBook, Moody’s, and FactSet directly inside your spreadsheet, without leaving Excel. Connections already set up in Claude.ai carry over to Excel automatically. That’s not a chatbot workflow. That’s a data pipeline.
It’s priced at $3/$15 per million tokens. Same pricing as Sonnet 4.5, unchanged despite the capability jump. For finance teams running analysis at scale, this arithmetic matters more than any benchmark number.
Why Most Finance Professionals Are Still Getting Mediocre Output
Even with all of that under the hood, most people are still getting analyst-intern quality output. Here’s why 👇
The model is extraordinarily capable but, by design, literal. Vague instructions produce vague output. A prompt like “build a DCF for this company” gives Claude almost no information about which FCF definition to use, how to handle the terminal value, what to do with missing data, or how to structure the output. Claude fills those gaps with defaults - and the defaults are rarely what a finance professional actually wants.
There’s a subtler failure mode too: without explicit instructions, Claude will project confidence it shouldn’t have. It will produce a sensitivity table with clean numbers and no indication that half the inputs were assumed. In finance, that’s worse than no output - it’s plausible-looking analysis that breaks under scrutiny.
The fix isn’t a better model. The fix is a better prompt structure.
The Prompting Framework That Changes Everything
Anthropic has published extensive documentation on what actually makes prompts work. Here’s what consistently moves the needle for financial analysis specifically.
1. Phase Your Prompts: Force Methodology Before Math
The single highest-impact change you can make is requiring Claude to commit to its analytical approach before it starts calculating. Most prompts skip this entirely, leading to inconsistent mid-model decisions - Claude choosing a WACC methodology halfway through that subtly contradicts its earlier assumptions, or selecting comparables without stating why.
Every complex financial prompt should start with a “Phase 1 - Structure Your Approach” block. Force Claude to declare which free cash flow definition it will use and why, which peer companies it will include and on what criteria, and what assumptions it is making wherever input data is missing.
The result is dramatically more internally consistent output - and an assumption log you can review before trusting the numbers.
2. Use XML Tags - Claude Was Specifically Trained to Recognize Them
This is the most underused technique in finance and makes the most visible difference. Claude was trained to treat XML tags as structural markers. They tell Claude with precision what is background context (don’t respond to this), what is the task (do exactly this), and what are the guardrails (never do this).
Without tags, Claude sometimes treats your context as part of the deliverable, or ignores constraints buried in paragraph form. With tags, there’s no ambiguity:
<context>
You are analyzing a Series B SaaS company preparing for a growth equity raise.
LTM Revenue: $18M. LTM EBITDA: –$4M. ARR growth: 65% YoY. Net cash: $3M.
</context>

<instructions>
Build a unit economics analysis. Before any calculations, state your
methodology and flag every assumption you are making with [ASSUMED].
</instructions>

<constraints>
- Do NOT present a scenario without stating what must be true for it to hold
- Show LTV/CAC sensitivity to a 3-point change in churn rate
- Flag the top 3 assumptions that most change the conclusion
</constraints>
Tag names are flexible - <background>, <data>, <task>, <rules> all work.
Consistency matters more than convention.
3. Replace Freeform Descriptions With Labeled Input Fields
The classic template mistake is the freeform placeholder: [DESCRIBE COMPANY, INDUSTRY, FINANCIALS]. It invites vagueness on your end, which produces vagueness on Claude’s end.
Replace it with specific, labeled data fields:
INPUT DATA:
- LTM Revenue: $42M
- LTM EBITDA: $8.4M (20% margin)
- LTM Capex: $2.1M (5% of revenue)
- Net debt: $12M
- Shares outstanding: 24M
- Tax rate: 26%
- Closest public comps: [3 specific tickers]
When you give Claude labeled inputs, it uses them precisely and flags where data is missing. When you give it a paragraph description, it quietly fills gaps with assumptions it doesn’t surface.
4. Build Verification Steps Into the Prompt
Great financial models have error checks. Great prompts should too. Ask Claude to verify its own work before presenting output.
For a three-statement model:
Confirm explicitly: balance sheet balances every year; ending cash on the
balance sheet ties to the cash flow statement; interest expense ties to
the debt schedule.
For a DCF:
Reconcile your perpetuity growth and exit multiple terminal values.
If they diverge by more than 20%, explain why before continuing.
These checks catch inconsistencies that would otherwise require your own review to find, and make Claude more careful throughout because it knows the verification is coming.
5. Mandate Honest Uncertainty Flagging
This is where finance prompts must be fundamentally different from every other domain. In creative writing, confident output is the goal. In finance, unwarranted confidence is a liability.
Add this block to every financial prompt:
<constraints>
- Label every non-provided input as [ASSUMED] with your reasoning
- Identify the top 3 assumptions that, if wrong, would most change the output
- State the breakeven level for each key assumption
- Do not present a bear case that is simply a percentage haircut on base —
  it must reflect a coherent negative scenario with a specific narrative
</constraints>
This single block transforms output from “confident-sounding analysis” to “trustworthy analysis with a visible uncertainty map.”
6. Specify the Output Structure Explicitly
Claude defaults to whatever format seems most natural. For financial work, that default is almost never right. Specify the structure every time:
<output_format>
1. Methodology statement (before any numbers)
2. Assumptions log ([ASSUMED] vs. [CALCULATED])
3. Core model output in table format
4. Sensitivity analysis (minimum 2 data tables)
5. Top 3 risks with breakeven levels
</output_format>
The Difference in Practice
Here’s the same task prompted two ways.
❌ How most people prompt:
Build a DCF for a SaaS company with $20M revenue and 30% growth.✅ What the framework produces:
<context>
SaaS company: $20M LTM Revenue, 30% YoY growth, 15% EBITDA margin,
$2M annual capex, $5M net debt, 10M diluted shares, 25% effective tax rate.
Closest public comps: HubSpot, Zendesk, Freshworks.
</context>

<instructions>
Build a complete DCF valuation.

Phase 1 — Methodology: State your FCF definition, projection stage
structure, and WACC derivation before any calculations. Label every
[ASSUMED] data point.

Phase 2 — Build: FCF projections (Years 1–5), WACC, terminal value
via both perpetuity growth and exit multiple — reconcile any >20%
divergence. Valuation bridge from EV to equity value to price per share.

Phase 3 — Challenge: Identify the 3 assumptions that most change the
result. State the breakeven level for each.
</instructions>

<constraints>
- Do not use round numbers unless the input data supports them
- Show WACC sensitivity in ±50bps increments
- Scenarios must be coherent narratives, not percentage haircuts
- Flag where this analysis would change materially with better data
</constraints>

<output_format>
1. Methodology statement
2. Assumptions log ([ASSUMED] vs. [CALCULATED])
3. FCF projections table with explicit growth and margin assumptions
4. WACC build
5. Terminal value (both methods, reconciled)
6. Valuation bridge: EV → Equity Value → Price per Share
7. Two sensitivity tables
8. Scenario summary (Bear / Base / Bull with narratives)
9. Top 3 assumption risks with breakeven levels
</output_format>
The first prompt produces a generic DCF with invented numbers that feel authoritative. The second produces a structured analysis with visible assumptions, internal consistency checks, and a calibrated uncertainty map - the kind of output you could show to an investment committee.
Claude in Excel With Live Data
With Sonnet 4.6’s MCP connector support in Claude for Excel, the framework above becomes substantially more powerful. Instead of pasting input data manually, Claude can pull live financials directly from PitchBook, FactSet, S&P Global, or Moody’s - inside your spreadsheet - and then run the full analysis in context.
Connections already set up in Claude carry over to Excel automatically. For finance teams embedded in spreadsheet workflows, this removes the last manual handoff in the process. That’s worth saying plainly: if you’ve already configured your data connectors in Claude, they are live in Excel today.
The 12 Finance Prompts
The following 12 fully engineered prompts cover the complete toolkit of investment banking and PE financial analysis. Each one is built on every principle above: phased methodology, XML structure, labeled data inputs, verification steps, uncertainty flagging, and explicit output formats.
What’s inside:
DCF Valuation Model - Full three-phase build with WACC, terminal value reconciliation, and sensitivity tables engineered in
Three-Statement Financial Model - Fully linked IS/BS/CFS with balance check verification and supporting schedules
M&A Accretion/Dilution Analysis - Pro forma income statement, EPS bridge, break-even synergy analysis, and deal recommendation framework
LBO Model - Sources & uses, debt structure by tranche, cash sweep, IRR/MoM by exit year, and multiple
Comparable Company Analysis - Peer selection methodology, comps table, premium/discount analysis, football field output
Precedent Transaction Analysis - Transaction screening, deal table, strategic vs. financial buyer split, market conditions adjustment
IPO Valuation & Pricing - Offering structure, comparable IPO analysis, buy-side perspective pricing, first-day pop analysis
Credit Analysis & Debt Capacity - EBITDA quality assessment, leverage benchmarks, debt structure recommendation, downside stress test
Sum-of-the-Parts Valuation - Segment-by-segment methodology, corporate overhead allocation, equity bridge, conglomerate discount analysis
Operating Model & Unit Economics - Bottom-up revenue build, cohort analysis, LTV/CAC framework, burn and runway projection
Sensitivity & Scenario Analysis - Assumption hierarchy, tornado chart logic, Monte Carlo framing, margin of safety calculation
Investment Committee Memo - Full IC memo structure with recommendation-first format, returns table, risk registry
Every prompt has specific input data fields you fill in once. No reformatting, no adapting generic templates. Paste your numbers, run the prompt, and get output that holds up to scrutiny.
If Sonnet 4.6 outperforms Opus on the finance agent benchmark, the limiting factor was never the model. It was always the prompt.
To make Claude even more powerful, I’m also sharing the ultimate guide on how to turn Claude from a chatbot into a thinking partner, and how I built an AI operating system to run a startup with Claude. It has everything you need to build the one-person unicorn 🦄
