
Turn Claude in Excel Into Your Senior Financial Analyst 📈
Excel users are leaving 90% of Claude on the table. Here’s the framework & 15 prompts that turn a $20 sidebar into the most powerful analytical tool in your spreadsheet 🤖

👋 Hey, Linas here! Welcome to another special issue of my daily newsletter. Each day, I focus on 3 stories that are making a difference in the financial technology space. Coupled with things worth watching & the most important money movements, it’s the only newsletter you need for all things when Finance meets Tech. If you’re reading this for the first time, it’s a brilliant opportunity to join a community of 370k+ FinTech leaders:
A senior financial analyst costs $150,000 a year fully loaded. Claude in Excel costs $20 a month. And unlike any human hire, it reads your entire workbook before you ask your first question, traces formula dependencies across fourteen tabs in 30 seconds, and pulls live data from S&P Global, Moody’s, and PitchBook without leaving your spreadsheet.
Claude for Excel launched as a research preview for Enterprise users in October 2025, then opened to Pro subscribers in January 2026. Within weeks, people who build financial models for a living started paying attention.
Not because it writes formulas. Every AI does that. But because it understands the architecture of an entire workbook and works from that understanding.
But the coverage missed what matters most.
Most people who’ve tried Claude in Excel are still using it like a search engine that happens to live inside their spreadsheet. They ask for a formula, get a formula, and go back to working manually. That captures maybe 10% of what the tool can deliver.
The people getting 10x the value have made a different mental shift entirely. They treat Claude like a senior analyst who has already read the entire model before the meeting started. They delegate entire workflows, not individual formula lookups. They’ve stopped writing better prompts and started building better systems inside their workbooks.
Below is the complete framework, followed by 15 fully engineered prompts (you can copy and paste) that turn Claude in Excel into an operator that handles your model audits, scenario analysis, data cleaning, financial reporting, and more.
All while you do something else.
What Claude in Excel Actually Is (& Why It’s Different From Copilot)
Before the framework, let’s be precise about what we’re working with. Claude in Excel is not a cell formula like =GPT(). It’s not autocomplete for spreadsheets. It’s not a chatbot that happens to live near your data. It’s a fundamentally different category of tool.
Microsoft Copilot helps you write formulas faster. You describe what you want, and it gives you the syntax. You are still the operator. Copilot is your reference manual.
Claude in Excel is a structural analyst. When you open the sidebar, Claude reads your entire workbook: every tab, every formula, every cell dependency, every named range, every conditional formatting rule, every data validation constraint. It builds a map of how your model works. Then you have an intelligent conversation with that map.
The distinction matters because it changes what you can ask for.
With Copilot, you ask: “Write me a SUMIF formula for column B.”
With Claude, you ask: “If I change the growth rate in B5, what else in this workbook breaks?” And Claude answers with specific cell references you can click to verify, because it already mapped the dependency chain before you asked.
Every explanation comes with cell-level citations. When Claude says “Revenue in B12 is calculated by multiplying the unit price in B10 by the projected volume in B11,” you can click those references and check. It’s not a black box. It shows its work.
The key capabilities that make analyst-level delegation possible:
→ Full workbook comprehension. Claude reads every tab simultaneously. Not just the active sheet. Every formula, every cross-tab reference, every named range. It understands the architecture of your model, not just individual cells.
→ Change tracking with explanations. Every cell Claude modifies gets highlighted. Every change comes with an explanation of what moved and why. You review before accepting. Nothing happens without your approval if you enable “Ask Before Edits” mode.
→ External file ingestion. You can drag PDFs, CSVs, images, and other Excel files directly into the Claude sidebar. Working from a PDF report? Claude extracts tables and data from it and organizes them in your spreadsheet. This works with JPEG, PNG, GIF, and WebP images too.
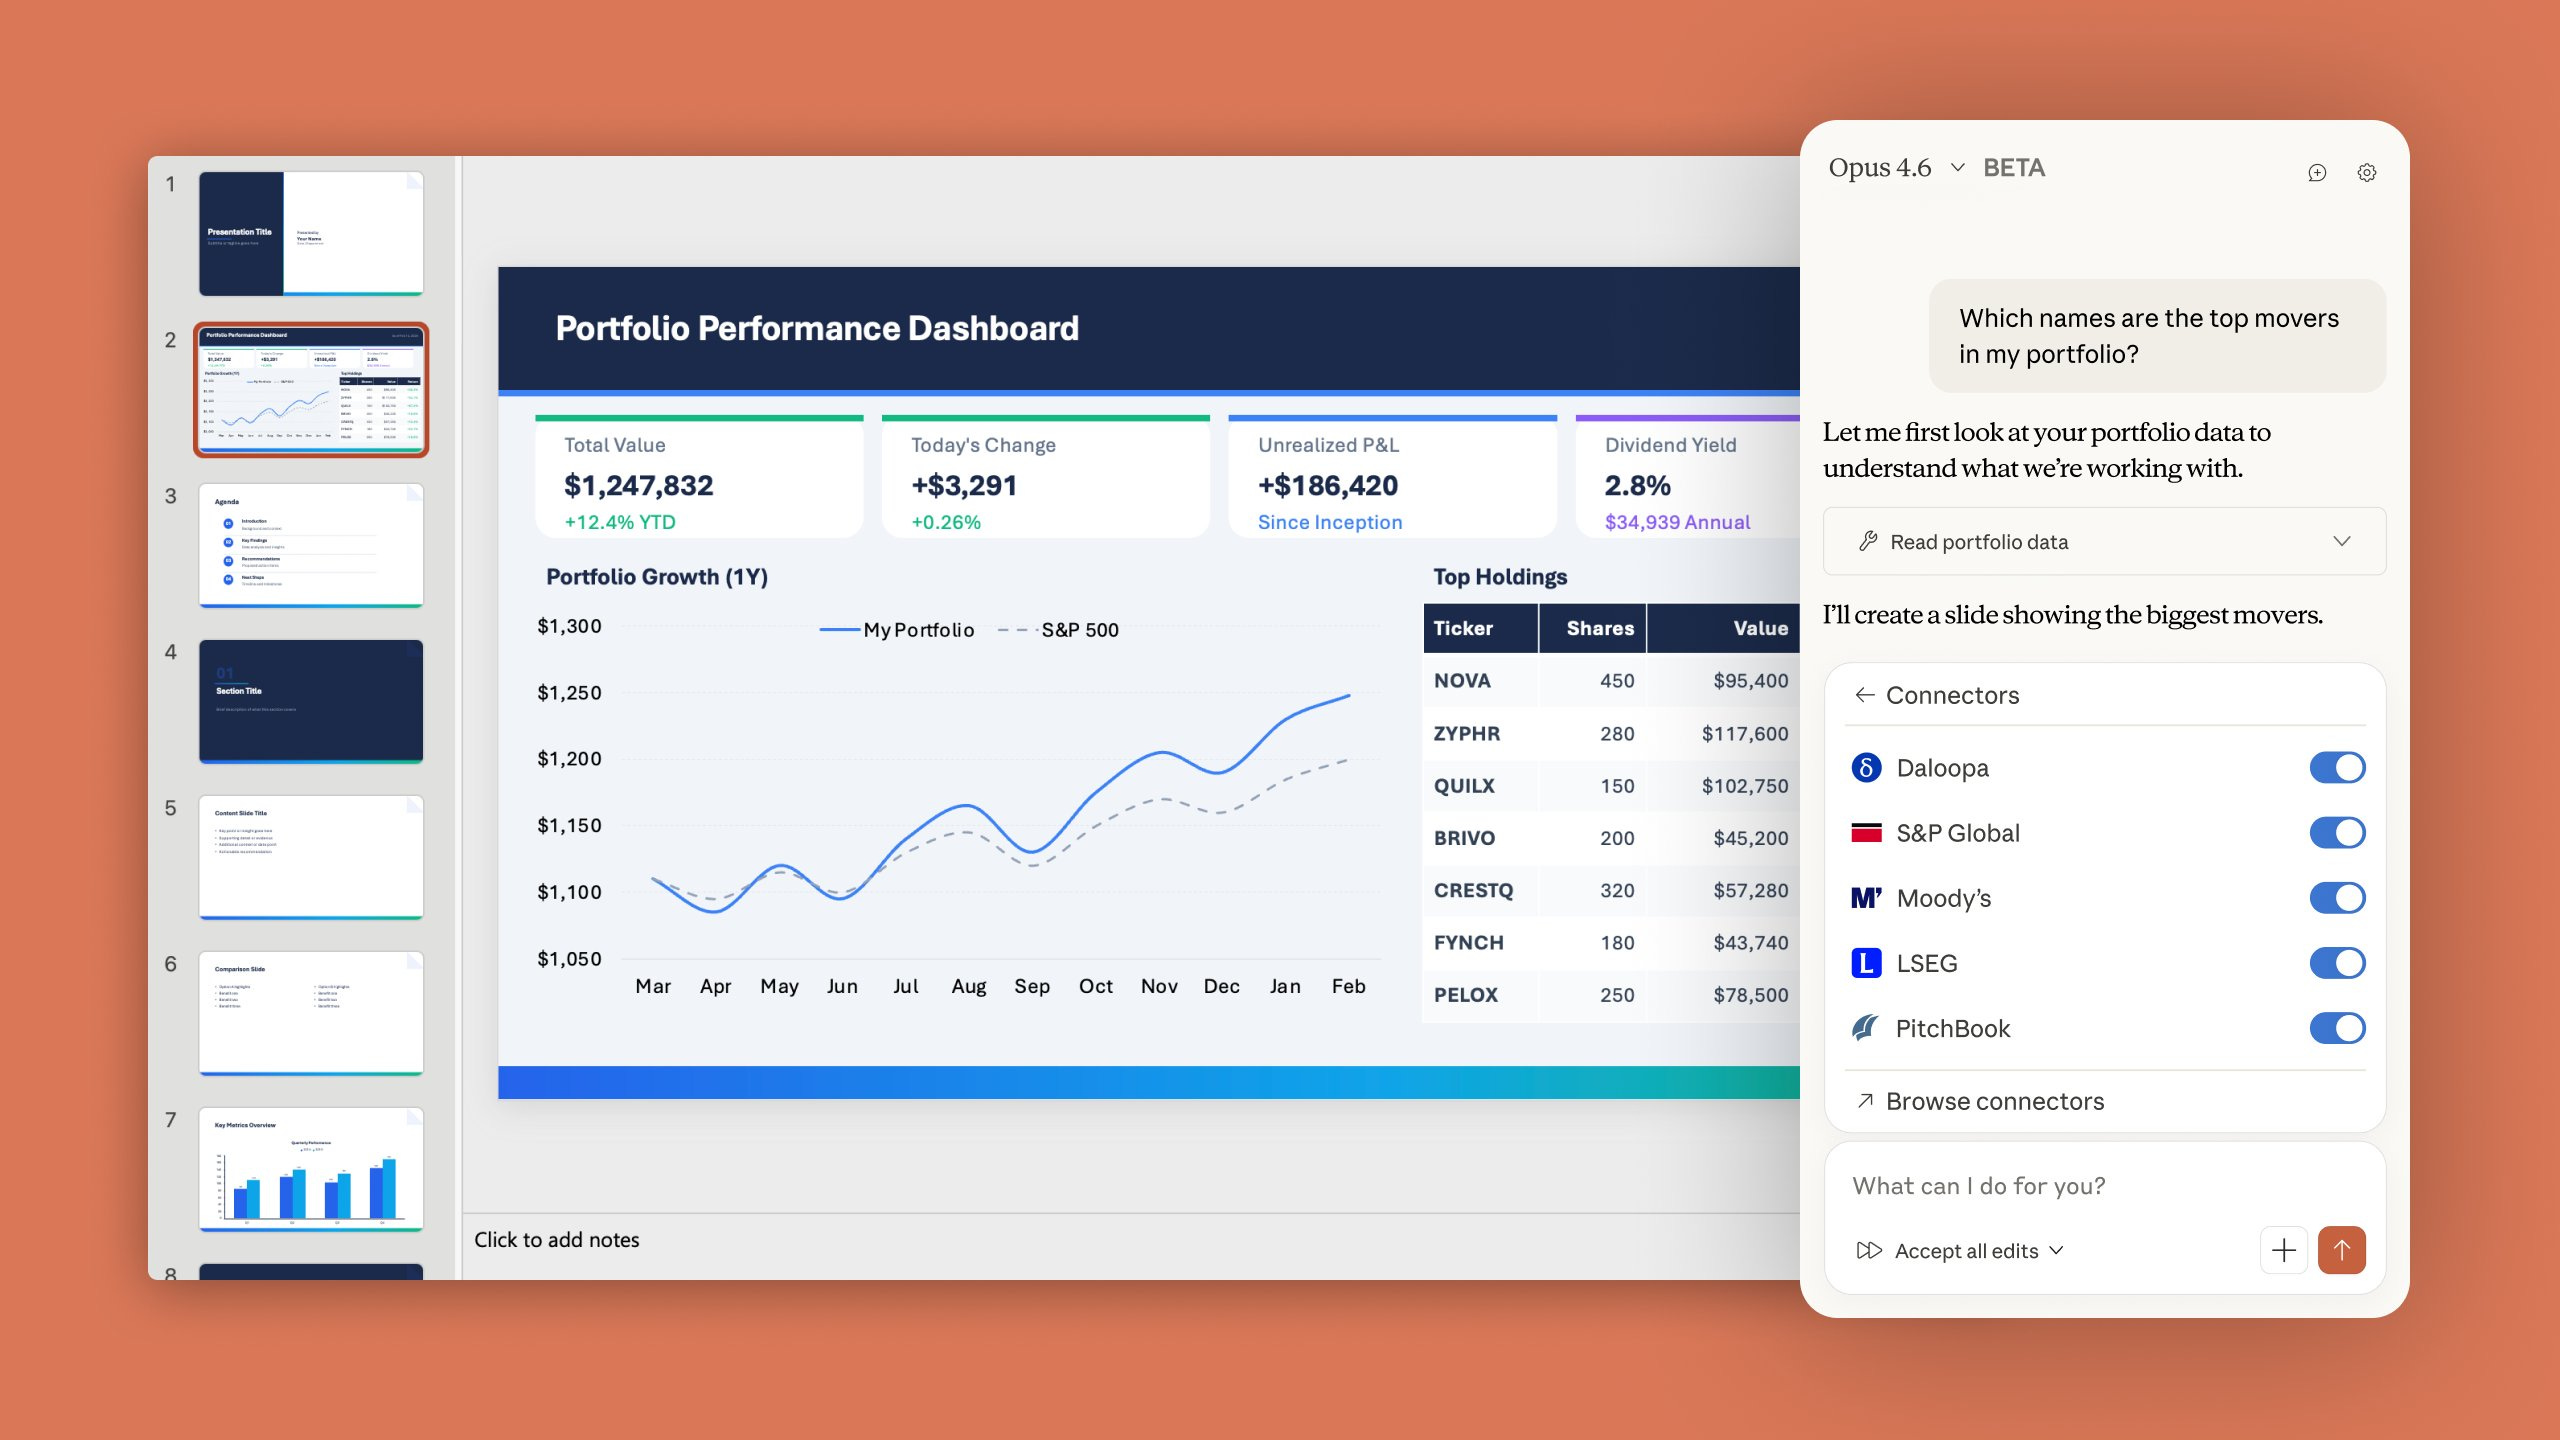
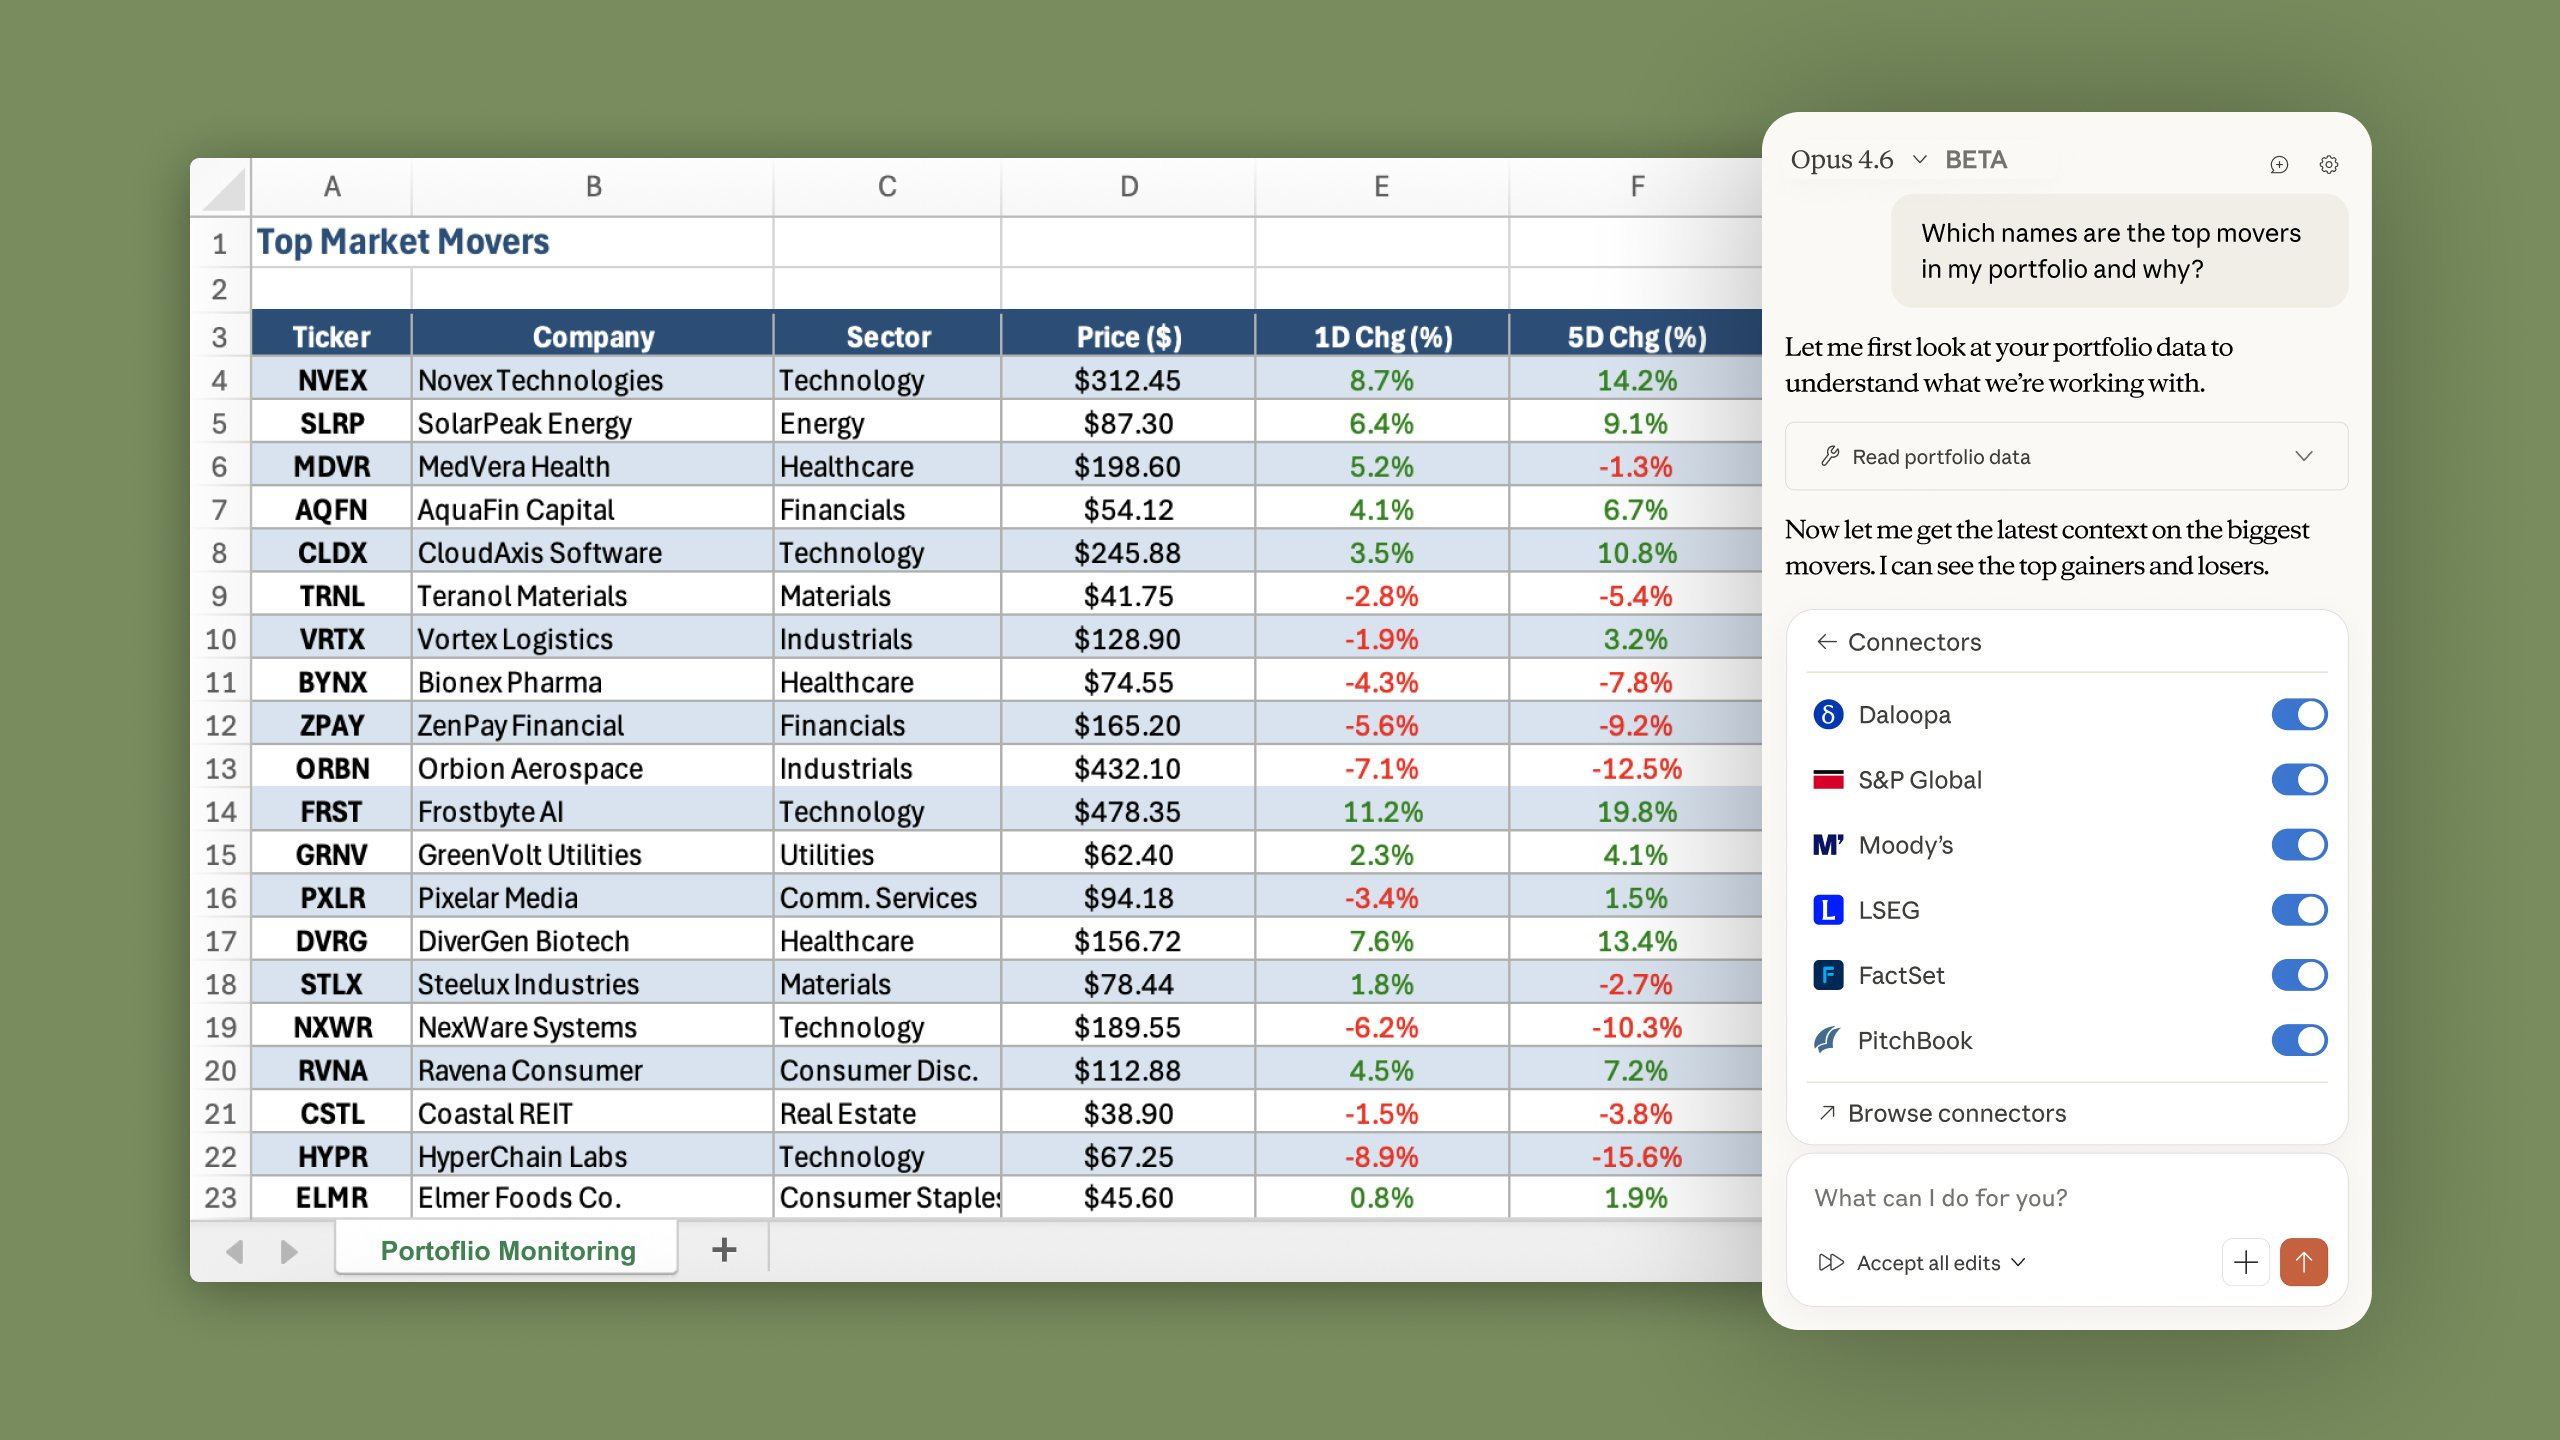
→ MCP data connectors. This is the feature most people don’t know about, and it’s the one that changes everything. Claude for Excel connects to S&P Global via Kensho, LSEG for live market data, Moody’s for credit ratings across 600M+ companies, Daloopa for financial data extraction, PitchBook for PE and VC data, FactSet for analytics, Aiera for real-time earnings call transcripts, and Morningstar for investment research. If you have these connectors configured in your Claude account, they work automatically in the Excel sidebar. No additional setup.
→ Pre-built financial skills. Anthropic shipped 6 pre-configured agent skills for financial services: comparable company analysis, discounted cash flow models, due diligence data packs, company teasers and profiles, earnings analyses, and initiating coverage reports. Select a skill, provide the company or dataset, and Claude runs the full workflow.
→ Model selection. You can switch between Sonnet 4.6 (faster, good for routine operations) and Opus 4.6 (more powerful, better for complex multi-tab models and deep analysis) directly in the sidebar. Default to Sonnet for orientation questions and simple edits. Switch to Opus when you need it to build something, debug something tricky, or trace complex dependencies.
Even with all of that capability, most people are getting formula-lookup output. The gap between mediocre and senior-analyst-quality results comes down to how you structure your requests.
Why Most People Are Still Getting Mediocre Output
The model is extraordinarily capable but, by design, literal. Vague instructions produce vague output. A prompt like “fix my formula” gives Claude almost no information about what’s wrong, what the formula should do, or what the expected output looks like. Claude fills the gaps with defaults, and the defaults are rarely what you actually want.
There’s a subtler failure mode too: without explicit instructions, Claude will project confidence it shouldn’t have. It will build a scenario analysis with clean numbers and no indication that half the inputs were assumed. In finance, that’s worse than no output. It’s a plausible-looking analysis that breaks under scrutiny.
The fix isn’t a better model. The fix is a better working method.
Here’s what consistently moves the needle, drawn from Anthropic’s own documentation and months of real-world testing with complex financial workbooks.
The Framework That Changes Everything
1. Orient Before You Operate
Before modifying anything, ask Claude to explain the model. This is the single highest-leverage habit you can build. Every complex session should start with an orientation prompt.
❌ Less effective: Open a workbook and immediately ask Claude to change something.
✅ More effective: “Before we make any changes, give me a summary of each tab’s purpose, the main calculation flow between tabs, any formulas that look unusual or potentially broken, and all hardcoded assumptions I should know about.”
This takes thirty seconds. It gives you a shared understanding to reference in later prompts. And it gives Claude the context to avoid breaking dependencies when it starts making changes. Skip this step, and you spend 5 minutes fixing what Claude broke because it didn’t understand the model’s architecture.
Do this step and every subsequent prompt produces better output because Claude is working from a complete picture.
2. Reference Specific Cells, Not Vibes
Claude in Excel can see your entire workbook. Use that. The more specific you are about where to look and what to change, the better the output.
❌ Less effective: “Find the underperforming products.”
✅ More effective: “Flag every product in column A where revenue in column D declined more than 10% quarter-over-quarter and margin in column F is below 15%. Add a flag in column H.”
❌ Less effective: “Fix my formula.”
✅ More effective: “The formula in cell D8 is returning $142,000, but the correct total for confirmed orders only should be around $98,000. I think it’s including cancelled orders from column C. Check the logic and fix it.”
Quantitative criteria beat descriptive language every time. Numbers tell Claude exactly what to do. Adjectives make it guess.
3. Scope Every Operation
Prevent unintended changes by telling Claude exactly where to operate. Without scope constraints, Claude might modify cells you didn’t intend to touch, especially in workbooks with complex cross-tab dependencies.
“Only modify cells in column E, rows 5 through 50. Do not touch any other columns or rows.”
“Add the sensitivity table on a NEW tab called ‘Scenarios’. Do not modify any existing tabs.”
“Recalculate projections in the Forecast tab only. Do not change anything in the Assumptions tab.”
This costs you one extra sentence per prompt. It saves you from reviewing hundreds of unintended cell changes. The tradeoff is obvious.
4. Ask for a Plan Before Execution
For any complex operation, have Claude outline its approach before executing. This is the equivalent of a senior analyst walking you through their methodology before building the model.
“I want to restructure the revenue model to support per-product revenue streams instead of a single blended number. Before making any changes, outline: which cells you’ll modify, what new formulas you’ll create, which existing dependencies might break, and your recommended approach.”
You review the plan. You adjust it. Then Claude executes. This catches errors at the cheapest possible point: before any cells are modified.
5. Mandate Assumption Flagging
In financial work, unwarranted confidence is a liability. Add this to any analytical prompt:
“Label every non-provided input as [ASSUMED] with your reasoning. Identify the top 3 assumptions that, if wrong, would most change the output. State the breakeven level for each key assumption.”
This single block transforms output from “confident-sounding analysis” to “trustworthy analysis with a visible uncertainty map.” Without it, Claude will produce clean numbers that feel authoritative.
With it, you know exactly where the analysis is solid and where it’s built on sand.
6. Break Large Operations Into Verifiable Steps
Don’t ask Claude to “build a complete financial model with sensitivity analysis and scenario comparison.” Instead, work in phases:
“Create the revenue projection tab with these assumptions.” Verify it. “Now create the expense forecast based on the headcount plan.” Verify. “Link these into an income statement on a new Summary tab.” Verify.
Each step is checkable. Errors don’t compound. And if something goes wrong in step three, you don’t have to unravel the entire model to find it.
7. Use the Data Connectors
If you have MCP connectors configured, name them explicitly in your prompts. This is the feature that turns Claude from “AI that reads your spreadsheet” into “AI that reads your spreadsheet and pulls live financial data into it.”
“Using Daloopa, retrieve Microsoft’s revenue, operating margin, and free cash flow for Q1 2023 through Q4 2024. Organize in a comp table with YoY growth rates calculated.”
“From S&P Global via Kensho, pull Tesla’s last 8 quarters of EBITDA and revenue growth.”
Connections already set up in your Claude account carry over to Excel automatically. For finance teams embedded in spreadsheet workflows, this removes the last manual handoff in the process.
No more “open terminal, find data, export to CSV, import to Excel, clean, restructure, analyze.” One prompt. One operation. Done.
Where Claude in Excel Falls Short (The Honest Version)
Knowing the limitations protects you from wasting time on tasks that aren’t ready yet. Here’s what you should be aware of:
No VBA or macro support. Claude can’t read, write, or modify macros. If your workflow depends on VBA, Claude won’t help with that part. It can generate M code for Power Query, but it can’t execute it within the add-in.
No Power Query or Power Pivot. These advanced Excel features aren’t supported. If your data transformation pipeline lives in Power Query, Claude operates on the output, not the process.
Chat history doesn’t persist. Close the sidebar, and your conversation disappears. Save prompts that work well in a separate document. This is annoying and will hopefully be fixed, but for now, treat every session as starting fresh.
Usage burns fast. Intensive sessions consume your Claude plan’s usage allocation quickly. Building models, running multi-tab analyses, pulling data through connectors: these all burn through tokens faster than simple chat. On a Pro plan ($20/month), expect to hit rate limits during heavy analytical work. Max plans ($100 to $200/month) exist for a reason.
Only .xlsx and .xlsm files. Legacy .xls format isn’t supported.
Security risk with untrusted files. A vulnerability called CellShock demonstrated that malicious instructions can be hidden in spreadsheet cells, manipulating what Claude does. Anthropic has added protections, but the practical rule stands: only use Claude for Excel with trusted spreadsheets. Don’t open the Claude sidebar on files from unknown sources.
Always verify outputs. Claude is good, not infallible. Especially for financial models, formulas that feed into investment decisions, or anything that goes to a client or committee. Build the structure with Claude. Verify the logic yourself.
Formatting is functional, not beautiful. Claude’s output is solid for working models but not polished enough for client-facing deliverables. Build the structure and formulas with Claude, then manually polish the presentation.
Getting Started (Takes Under 5 Minutes)
What you need: Microsoft Excel desktop app (Mac or Windows), and a Claude Pro ($20/month), Max ($100 to $200/month), Team, or Enterprise subscription. The free tier doesn’t include Excel access.
Install: Go to the Microsoft Marketplace, search for “Claude by Anthropic for Excel,” and install. Open Excel, activate the add-in via Home → Add-ins (Windows) or Tools → Add-ins (Mac), and sign in with your Claude account.
Keyboard shortcut to open the sidebar anytime: Ctrl+Alt+C (Windows) or Ctrl+Option+C (Mac).
First thing to do: Open your most complex spreadsheet. Type “Walk me through how this model works.” You’ll be convinced in 30 seconds.
Before you run any of the prompts below, enable “Ask Before Edits” mode for important workbooks, save a backup copy, and enable the Claude Log tab in settings for an audit trail of every action Claude takes.
15 Prompts That Turn Claude in Excel Into Your Senior Financial Analyst
Every prompt below is designed to hand Claude a complete job inside your workbook. Reference specific cells, tabs, and data ranges for best results. Replace the [BRACKETED] sections with your details.
To make Claude even more powerful, I’m also sharing an end-to-end guide on how to Turn Claude Sonnet 4.6 Into Financial Analyst That Never Sleeps, and how I turned Claude Cowork Into My Personal COO that does real work while I sleep. It has everything you need to make AI your most powerful resource & leverage, and automate your life 🤖
Prompt 1: Full Workbook Audit and Orientation
Run this first on any inherited or complex workbook. Claude reads the entire model and gives you the map before you touch anything.